
Design
Infographic Design for Sustainability, Research & Impact Communication
I transform complex information, data and research into clear visual communication for companies, consultancies, NGOs and research organizations.
Custom Sustainable Infographics
– Formats & Use Cases
Every infographic I create is custom-made, easy to understand, and visually memorable. Typical B2B applications include:
Sustainability &
ESG Reporting
Custom infographics, data visualizations and illustrations for sustainability and ESG reports, environmental impact assessments, and corporate sustainability communication.
Research &
Thought Leadership
Research infographics, scientific data visualizations, explanatory illustrations and editorial graphics for research reports, white papers, policy briefs and thought leadership publications.
Impact & NGO Communication
Impact infographics, data visualizations and visual storytelling for NGOs, social enterprises and sustainability initiatives – from impact reports and campaigns to stakeholder communication.
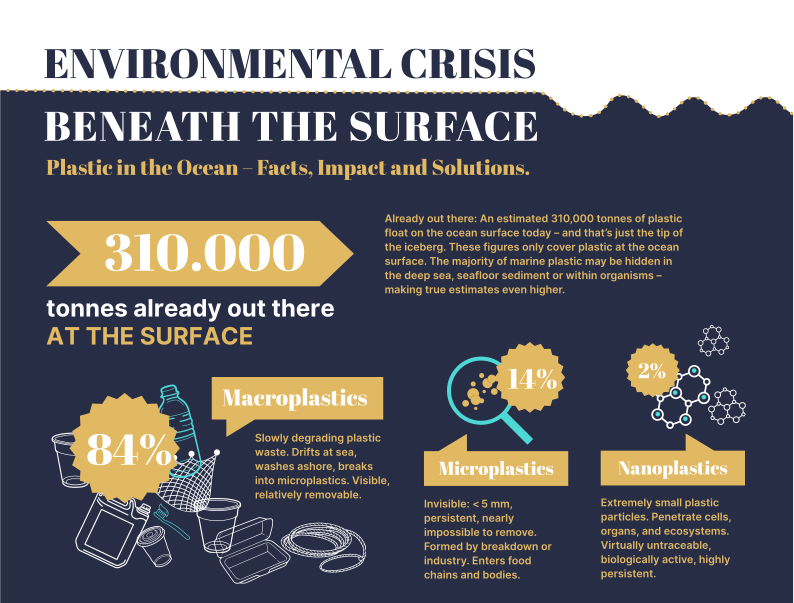
Complex topics need clear visuals – An Example
Infographics condense information so that facts are instantly understood: numbers become comparable, processes transparent, and connections visible. This saves time in comprehension, increases credibility, and makes both internal and external communication more effective.


Topics I Visualize
Environment & Climate Protection
Plastic waste, biodiversity, renewable energy transition, waste flows & recycling, water quality (drinking water, nitrate, pesticides, global comparisons), and sand mining ...
Corporate Processes & Sustainability Reports
Supply chain transparency (certifications, audits), ESG reporting (diversity and compliance), sustainability reports, and green marketing visuals ...
Research & Science Communication
Medicine & health, social sciences, climate research, and knowledge transfer for foundations and museums — including didactic infographics ...
Human Rights & Empowerment
Digital self-determination, gender equality, personal rights, press freedom, social justice, and inclusion — complemented by digital rights advocacy, global justice initiatives, and social impact infographics ...
Health, Nutrition & Wellness
Yoga, nutrition types, Ayurveda, Paleo, vegan and vegetarian lifestyles, mindfulness, superfoods, prevention, and active living ...
Our Infographic Design Process – clear, efficient, collaborative
Initial Consultation & Advice
I recommend method, style, and technique.
Briefing & Target Definition
I advise on audience, structure, and priorities.
Research & Data Review
I prepare it for visualization.
Concept & Storyboarding
You give feedback on the draft.
Design & Illustration
Almost there: while I finalize the infographic,
you can focus on what matters most.
Finalization & Delivery
You carry out the final check.
Our Infographic Design Process
– clear, efficient, collaborative
1. Initial Consultation & Advice
You outline goals and resources.
I recommend method, style,
and technique.
2. Briefing & Target Definition
You share content, objectives, and channels.
I advise on audience, structure, and priorities.
3. Research & Data Review
You provide reliable data.
I prepare it for visualization.
4. Concept & Storyboarding
I add structure and unique selling points.
You give feedback on the draft.
5. Design & Illustration
Almost there: while I finalize the infographic, you can focus on what matters most.
6. Finalization & Delivery
I export the right data formats.
You carry out the final check.
Sustainable Infographic Design Services that Convince
Infographics are a strategic tool in a fast-paced digital world — making complex content easy to understand, presentable, shareable, and ready for professional communication.